When a weekly “death cross” is visible on the charts, Bitcoin is now facing a new threat.
- The 50-week SMA has crossed below the 200-week SMA on the weekly price chart of Bitcoin, displaying a negative technical pattern.
- According to some analysts, the 50-week moving average serves as legitimate resistance, escalating the selling.
- Others disagree, noting that the death cross lags prices and is based on backward-looking moving averages.
A new obstacle for Bitcoin has emerged in the form of a weekly “death cross” that is visible on the charts. Although the timing appears to be in favour of the bears given that the asset dropped by about 5% last week, is Bitcoin actually in risk of collapsing once more?
At the 50-week SMA, Bitcoin is hitting a sell wall for the second consecutive week. Despite this, analysts’ views on the direction of the cryptocurrency’s price movement have varied.
Professional analysis of the Bitcoin “Death Cross”
A phenomenon known as the “death cross” in technical market research is causing some experts to express alarm. When an asset’s 50-day moving average price drops below its 200-day moving average on a chart, this happens.
According to market expert Alex Kuptsikevich, the death cross created on the weekly timescale creates a cautious picture of the near-term outlook and maintains the potential for a return to the $18,000-$16,300 range. The 50-week moving average is still acting as a meaningful barrier, in his opinion. Some observers disagree with this assessment and believe the death cross to be an inaccurate indication.
A death cross is a non-event, Cane Island Alternative Investments investment manager Timothy Peterson tweeted.
These are trailing indicators, which means they appear after a sharp fall.
Peterson said that the death cross has a long history of being inaccurate as a stand-alone indication in conventional markets. Bitcoin has maintained its place despite these viewpoints, at least temporarily.
Bitcoin’s Bullish Structure is lost
From the beginning of the year, the price of bitcoin has been moving higher thanks to a rising support line. It surpassed the $23,800 barrier level on February 21 and climbed as high as $25,250 for the year. This bullish trend, however, has now stopped as the price of BTC dropped and broke through the ascending support line on March 3.
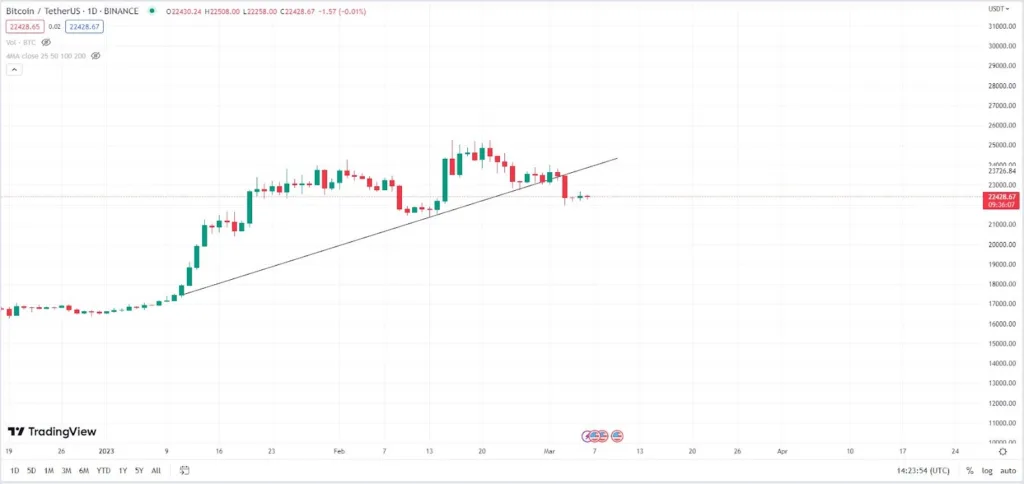
If the slide keeps on, support will most likely come from the 0.5 Fibonacci retracement level around $20,850 in the future price scenario. On the other hand, if the cryptocurrency rises past the $23,800 resistance level, it may move on to $27,000.
On the other hand
- The cryptocurrency market is notoriously unpredictable, and technical charts’ signals can frequently be disturbed, changing how the market will behave.
- It’s critical to keep in mind that technical indicators do not always provide a signal for upcoming price movements since opposing market sentiment might produce unanticipated results.
- Although technical analysis is a common technique for forecasting price changes, it’s important to keep in mind that every chart might be read in a different way. As a result, DailyCoin does not provide financial advice, and potential investors should do their homework and study before making an investment.
Why It’s Important
The swings of bitcoin sometimes indicate the direction of the industry as a whole. In the weekly price chart for Bitcoin, a negative indicator known as a “death cross” has appeared, indicating a potential continuation of the recent price decline. The pattern’s dependability is still in question, though.
Read on to catch up on the Bitcoin price movement:
At $23,650, Bitcoin falls short, while Ethereum faces choppy waters.
Stablecoin inflows have increased, which may indicate purchasing pressure. To learn more, go to:
Are Buyers Bullish Based on Stablecoin Inflows to Crypto Exchanges?