Crypto Price Today: Bitcoin below $22,800; crypto market cap crosses $1 trillion … “The crypto market had an exciting weekend with BTC crossing the $23,000 mark …
Despite the fact that the cryptocurrency market began November floating within a band of consolidation, on Wednesday, November 2, prices sharply climbed in response to good news that mostly affected the traditional markets, most notably from the FOMC.
The U.S. Fed announced a 75 basis point increase in projected interest rates, while Fed Chairperson Jerome Powel emphasised that the “final level of rates will be higher than previously expected.”
The markets quickly agreed that the news might be interpreted favourably, which was reflected in the short term despite the recurrence of a wave of declines on Saturday, November 5th. The news originally prompted a tumultuous reaction.
Everyone is wondering if the rebound has reached its full potential or if it will still continue as the price of digital assets plunges.
This week’s crypto market analysis will attempt to answer that query by first looking at the charts and fundamentals of Bitcoin.
Capitalization of the Market
Capitalization of the Market The market capitalization of the cryptocurrency industry had a downturn on October 21 that peaked at $853B. Nevertheless, the market was able to launch a comeback from that point on, breaking through the August 14th descending triangle pattern, which had long served as a major barrier to entry.
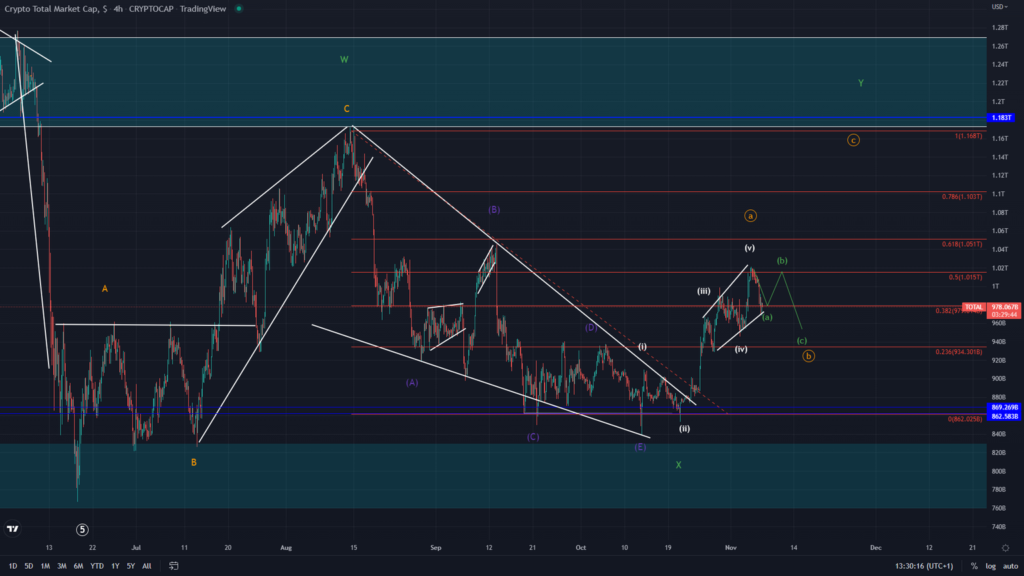
After falling on October 21st, the entire market capitalization of cryptocurrencies rose by 19.11%, peaking on November 5th at over $1.022 trillion.
The cryptocurrency market cap would have dropped down to $913B at its lowest point if the market had finished this rally on the fifth and a breakthrough below the ascending channel that is currently forming had occurred.
If prices continue to fall, a more advantageous scenario might emerge in which a bullish state could maintain its position above the $932B mark.
The issue remains: Will there be another surge in November despite the recent decline, albeit a modest one at this point?
The Dominance of Bitcoin
Bitcoin’s market share was on the rise for much of October, due largely to an uptrend lasting from the start of the month, until the 21st. During this time, the dominance of the leading digital asset rose from 41%, to 42.06% on the 21st. From this point, however, the “digital gold” experienced a sharp decrease in its power, rounding out the month at around 40.11%, below its starting point.

Overall, Bitcoin’s dominance is still close to the important horizontal level that it initially gained in May 2021. Despite numerous attempts to grow its market share, Bitcoin has been unable to maintain an upward trajectory due to the pressure of the market slump. It is possible that the market may hit new lows in November as a result, and it is still uncertain if the horizontal support area at about 40% will hold. Should it collapse, it might result in a new record low, one that is even lower than the 36,24% mark from January 2018.
However, historically, a decline in Bitcoin’s dominance has been regarded as a bullish indicator because it suggests that market players are investing in Altcoins at greater risk.
Bitcoin: Exchanges Worldwide Netflow
Twenty days of negative netflow were recorded by Bitcoin in October, with the biggest surges occurring on October 18 and October 26 at -36,209 BTC and -42,529 BTC, respectively.
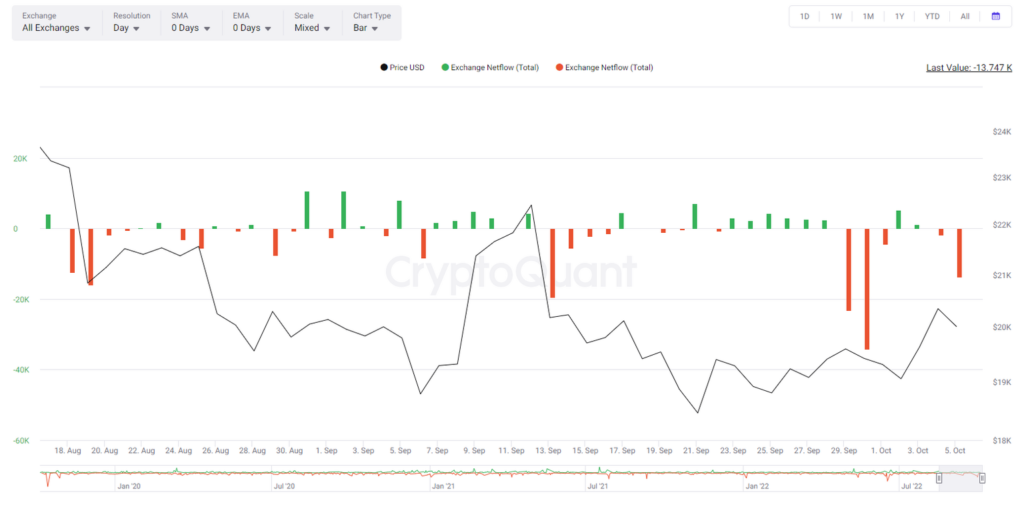
As expected, there was clear accumulative activity in October as Bitcoin was regularly removed from exchanges. That therefore had a favourable impact on its price, and despite recent, albeit minor, positive netflows, there are still no indications of a turnabout.
Even if the netflow revision for November was somewhat in the positive direction, the overall sum during the three days in question was just 18,183 BTC, which was less than the third-largest negative surge, which occurred on October 6th and totaled 20,739 BTC.
Bitcoin: The Universal Reserve Currency
The “all exchanges reserve” metric can be used to support the aforementioned idea. The number of Bitcoin held on exchanges decreased in October, starting at 2,271,851 and reaching its lowest point on October 26 at 2,133,948.
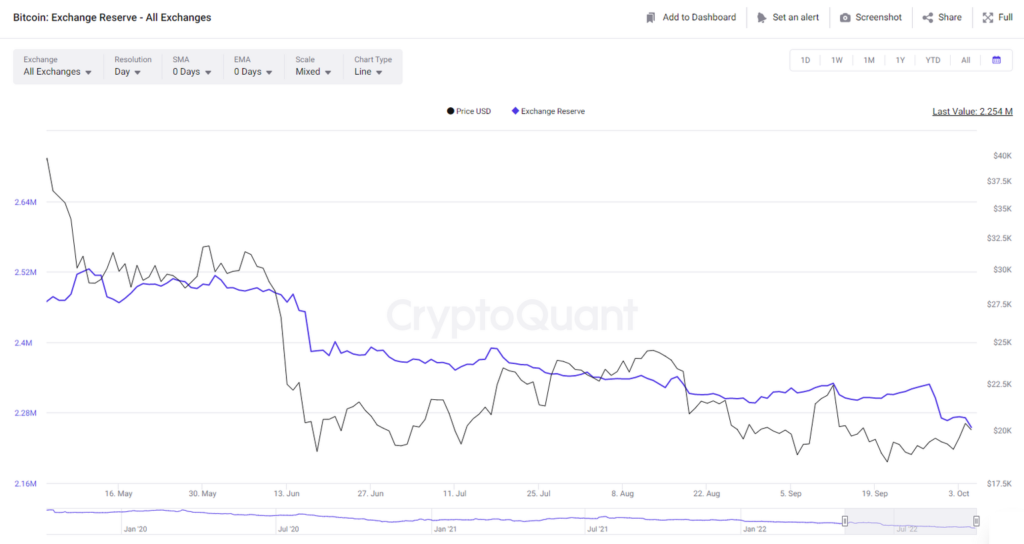
Even though this level has slightly increased as of the time of publication, the overall indicator still shows a downward trend, which is typically regarded as a good sign.
USD/BTC Technical Analysis
On November 5th, the price of Bitcoin surged sharply, surpassing $21,500. This supported a hasty course of action that had begun on October 21. However, since November 5th, the top digital asset has found it difficult to hold onto its position; at the time of writing, it is currently trading around $19,500.
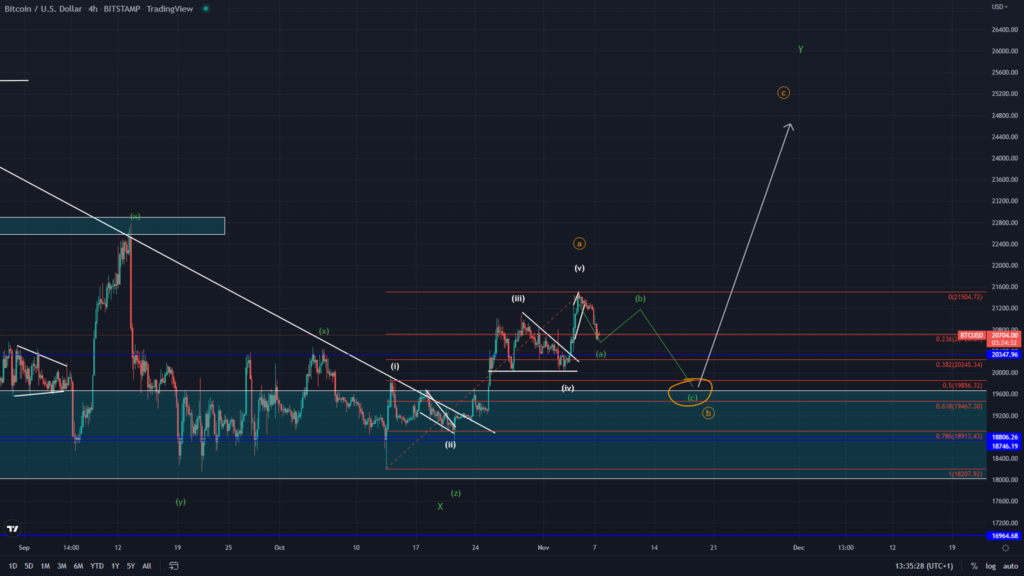
On the other hand, the market is getting closer to verifying the beginning of a “Y wave” of the highest degree (green, Minor count), which suggests an upside in the $26,000 level, as a result of the surge validating the impulse wave.
If this prediction comes true, the initial impulse, which occurred between October 21 and November 5th, would be regarded as the “A wave” of a lesser degree, suggesting that the market may anticipate a descending move from a “B wave” (orange, Minute degree).
As a result of the substantial horizontal crossings and Fib levels, the B wave may retrace to a level as low as $19,650 after this collapse, providing additional evidence.
A further upward-trending “C wave” might be predicted in this scenario to complete the pattern, which could result in the price of Bitcoin returning to its August high of about $25,000.
The overall outlook is still favourable according to the Bitcoin Hashrate
Network statistics, and Bitcoin’s hashrate is currently at an all-time high.
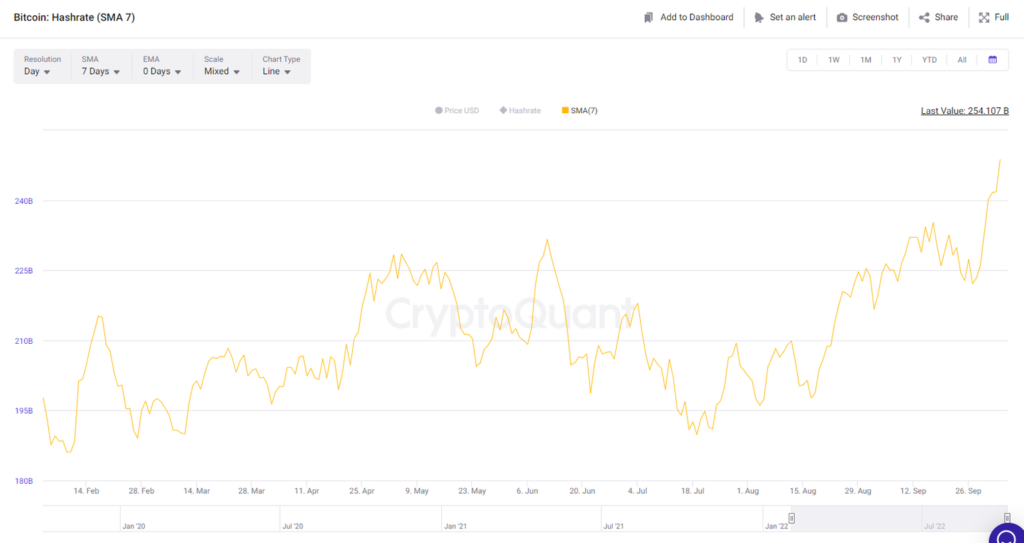
Beginning on October 1, Bitcoin’s hashrate steadily increased until October 11 when there was a small correction. But since then, the hashrate has picked up speed once more, peaking at 272B.
Bitcoin: Number of transactions
The rate of performed transactions has also increased, breaking out of a slump to record highs not seen in a while.
The rising volatility anticipated in the asset’s price action, which may boost overall network activity, provides more encouraging signs.
Conclusion
The uptrends that began building on October 21st have been continuing throughout the past week in the cryptocurrency market, with greater highs reinforcing the impulsiveness of the original rise.
As a result, the relocation was probably finished on November 5; a decline is currently taking place. This is anticipated to continue over the next few days, but merely as a corrective move before the market can continue to rise, possibly reaching record highs not seen since mid-August, particularly for cryptocurrencies like Ethereum (ETH) and Binance Coin (BNB).
On-chain data for Bitcoin lends credence to the idea of positive price activity, as accumulation was evident over the prior time period. The fact that Bitcoin’s network statistics remain positive and that Altcoins strengthened their positions during the previous week further supports the bullish outlook.
There will probably be some bearishness in the coming week, but mainly bullish price activity could be anticipated after that.